
IBM Instana
Make Application Lifecycle Monitoring Simple with Instana
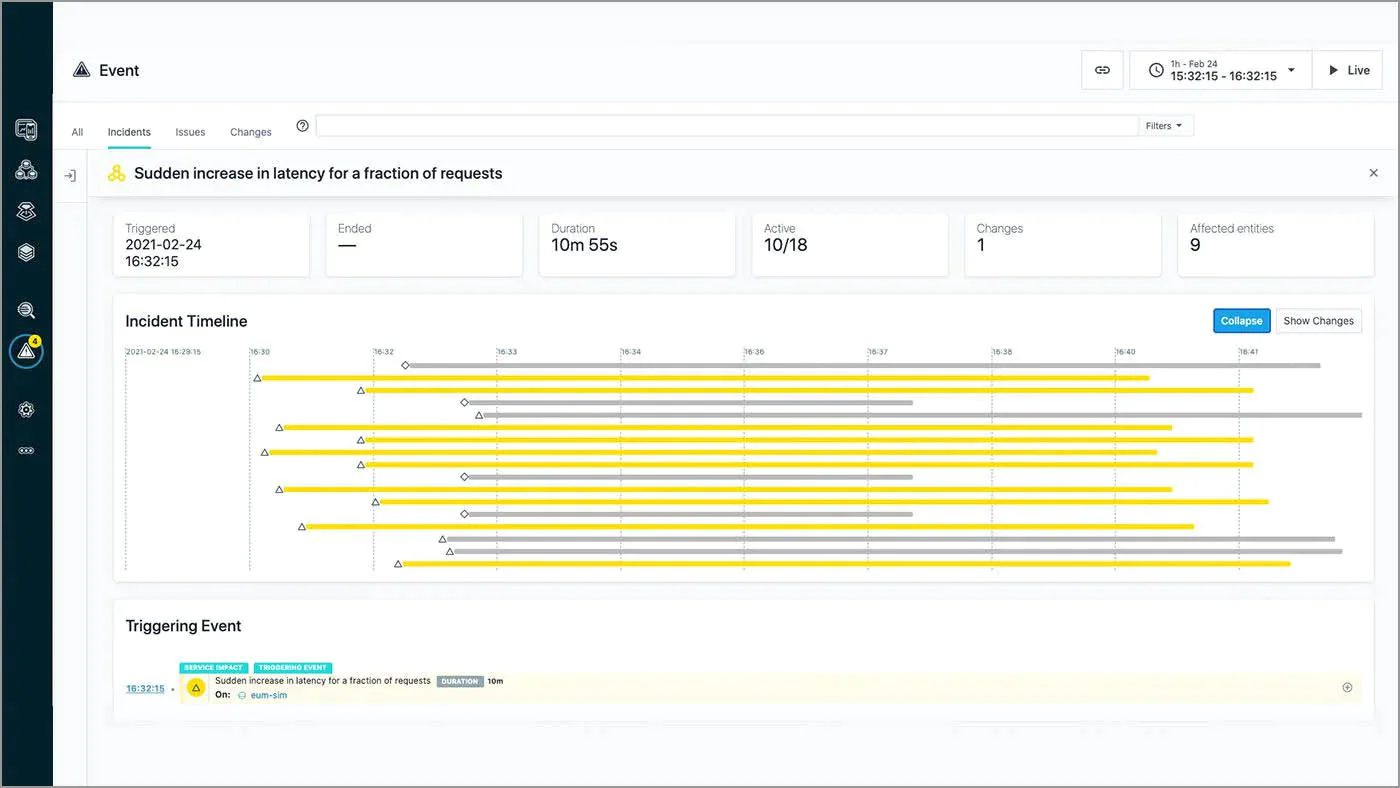
Instana is the modern answer to observability.
Unlike previous generations of APM and Monitoring, Instana automatically discovers and collects performance telemetry continuously, decreasing the time necessary to identify and repair system problems.
Increase Efficiency with Observability by Instana

Observability has emerged as the key innovation in Application Performance Monitoring (APM). IT shops need observability to compensate for the number of applications and speed of deployments in modern enterprise applications. With Observability, IT operations no longer have to rely on a diagram of how an application is supposed to work. Instead, the observability platform assembles a dynamic view of how the application works. Instana integrates with existing instrumentation built into application and infrastructure components and provides tools to add instrumentation to these components that do not expose any telemetry.
Observability Focuses on Four Main Telemetries
 Logs: Granular, timestamped, complete, and immutable records of application events. Among other things, logs can be used to create a high-fidelity, millisecond-by-millisecond record of every event, complete with surrounding context that developers can 'play back' for troubleshooting and debugging purposes.
 Metrics: Sometimes called time-series metrics, are fundamental measures of application and system health over a given period, such as how much memory or CPU capacity an application uses over five minutes, or how much latency an application experiences during a spike in usage.
 Traces: Record the end-to-end 'journey' of every user request, from the UI or mobile app through the entire distributed architecture and back to the user.
 Dependencies: Also called dependency maps, dependencies reveal how each application component is dependent on other components, applications, and IT resources. After gathering this telemetry, the platform correlates it in real-time to provide DevOps teams, site reliability engineering (SREs) teams, and IT staff complete, contextual information. This is the what, where, and why of any event that could indicate, cause, or be used to address an application performance issue.
SEE HOW INSTANA CAN HELP YOU & START A FREE TRIAL
Dig Into the Technical Side of Observability
Support Your Business Directly from the Source
To explore the basic features of Instana, check out the test harness created by Instana’s engineers. Play around with successful and failed system behaviors and take a guided tour. Start an Instana demo today.
Ready to Try Instana?
This trial will allow you to try Instana on your systems, providing full visibility to the product including dashboard functionality, agent installation, and AI engines that will help you contextualize the behaviors of your system.
Get In Touch!
Bill DeSpain
President
P: 940.300.6384
E: bdespain@daisource.com
Justin Toler
Director
Customer Success
P: 512.516.1885
E: jtoler@daisource.com
Greg Zuanich
Executive Vice President
Sales & Marketing
P: 832.723.7071
E: gzuanich@daisource.com
About Us
DAI Source is a noted technology and solutions firm based in Irving, Texas providing consulting services in Data Management, Analytics and Security Solutions to a broad range of clients across the U.S.

get social
© 2020 | All Rights Reserved | Privacy Policy | Design by Lift Division